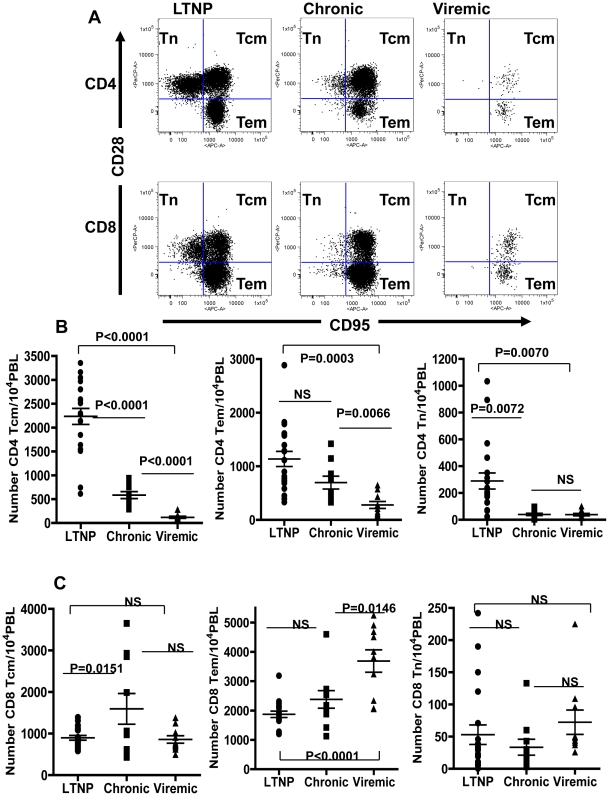
Figure 3. Flow cytometry analyses for the distribution of the memory subsets of the CD4+ and CD8+ T cells.
Panel A: data from a representative animal from each of the three groups with different viral loads: Long-term non-progressors (LTNP), chronic viremia (Chronic), and highly viremic (Viremic). The memory cells were differentiated on the basis of CD28 and CD95 expression into naïve (Tn CD28+ CD95−), central memory (Tcm CD28+ CD95+) and effector memory (Tem CD28− CD95+) subsets. Panels B and C: comparison of the average values for the numbers of the different memory subsets of CD4+ T cells (B) and CD8+ T cells (C) in all the animals tested in the LTNP, Chronic and Viremic groups of monkeys. The data are shown as the mean ± SEM. The Horizontal bars represent the group mean, error bars represent SEM. Statistical differences between groups are indicated by the p values.

