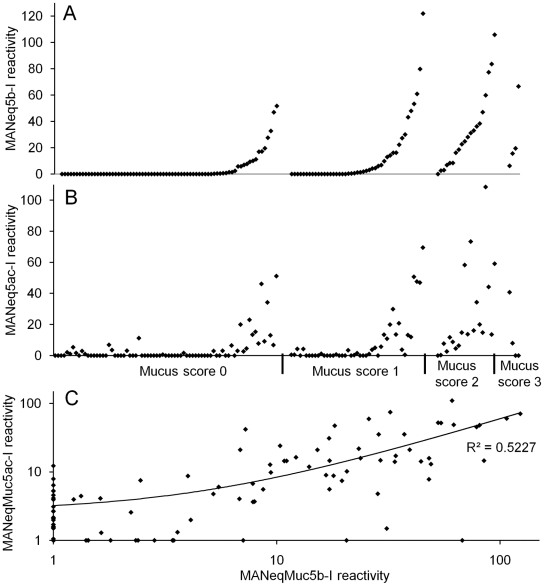
Figure 7. Correlation between mucus score and mucin amounts of tracheal washes from Thoroughbred horses in training.
Graphical representation of the mucus score versus the MANeq5b-I (panel A) and MANeq5ac-I (panel B) reactivity for each tracheal wash sample. On graphs A and B, the samples are ordered first according to their mucus score then according to their MANeq5b-I reactivity. ANOVA analysis showed that there was a strong association between the increase of the mucus score and the increase of the mucin antibody reactivity (p<0.001 for both mucins). For the ANOVA analysis, samples from mucus score 2 and 3 were grouped due to low sample number in the mucus score 3 group. (Panel C): Graphical representation of the correlation between Muc5b and Muc5ac content of tracheal wash samples (p<0.001).

