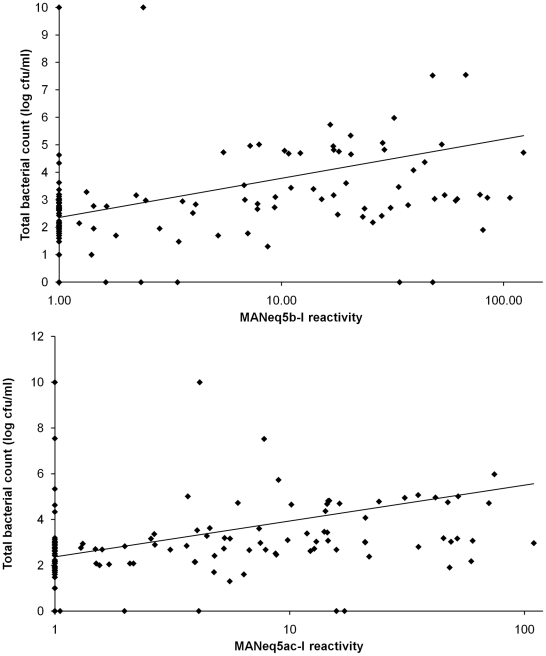
Figure 8. Correlation between mucin specific antibody reactivity and bacterial count.
Top panel: Graphical representation of the association between the MANeq5b-I response and the total bacterial counts (p<0.001) Bottom panel: graphical representation of the association between the MANeq5ac-I response and the total bacterial counts (p<0.001).

