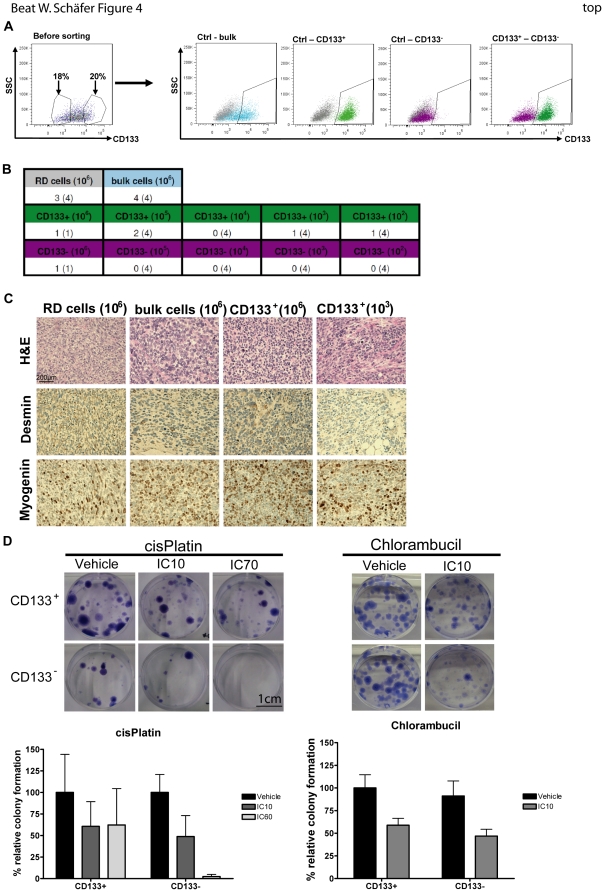
Figure 4. CD133+ RMS cells are more chemoresistant and tumorigenic.
A) RD cells were stained for CD133 (blue) and sorted into CD133+ (green) and CD133− (violet) populations with a MoFlo high speed cell sorter (DakoCytomation). Unstained RD cells were used as control (grey). After sorting the different fractions were reanalyzed by flow cytometry. B) Limited dilutions in vivo of different subpopulations (106, 105, 104, 103and 102). Bulk stained (106) and unstained cells without sorting (106) were used as controls. Cells were injected i.m. into NOD/Scid mice (n = 4) and tumor growth measured. Numbers indicate mice with growing tumors. C) Immunohistochemical (IHC) analysis of all xenograft tumors (H&E, Myogenin and Desmin). Representative stainings are shown. D) Clonogenic assay with sorted subpopulations (CD133+ and CD133−). Cells were treated with cisPlatin (IC10 = 10 µM and IC60 = 50 µM) and Chlorambucil (IC10 = 6.45 µM). Colonies were visualized by crystal violet. cisPlatin: mean of 3 independent sortings ± SEM; Chlorambucil: mean of 2 independent sortings ± SEM. For D) ★★ P = 0.0377; ★ P = 0.0241. Abbreviations: IC, inhibitory concentration; ctrl, control.

