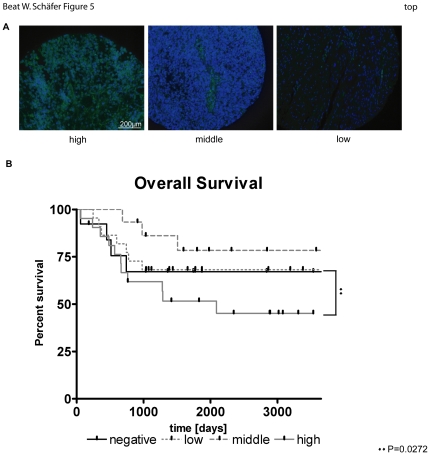
Figure 5. High expression of CD133 correlates with a poor survival rate.
Immunofluorescence staining of a human RMS TMA with CD133 (green). Nuclei were counterstained with DAPI (blue). Two values were chosen for scoring: Staining intensity (1 = low, 2 = middle and 3 = bright) and number of positive cells (0 = 0; 1 = 1–10; 2 = 11–20; 3≥21). Both values were added up to the scorings negative (0 and 1), low (2 and 3), middle (4) and high (5 and 6). A) Stainings of representative tumor sections are shown for high, middle and low scorings. B) Overall survival of eRMS patients as shown by a Kaplan-Meier curve. For A) ★★ P = 0.0272.

