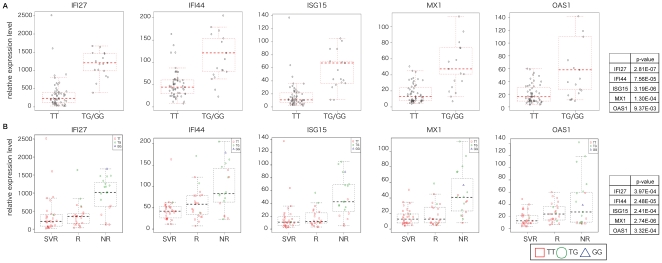
Figure 2. The relationship among the expression of IFN-related genes, IL28B polymorphism and clinical outcome.
(A) The relationship between expression of ISG and five related genes (MX1, OAS1, ISG15, IFI27, and IFI44) in the liver of CH patients and IL28B with the major (TT) or minor (TG or GG) genotype (rs8099917) is shown. The p-value of the relationship between gene expression level and IL28B genotype is also depicted. (B) The relationship among the expression level of the above five genes, clinical outcome, and IL28 genotype in individual cases. Red square, green circle, and blue rectangle represent TT, TG, and GG in IL28B genotype, respectively. The p value was calculated from a linear regression employing outcome as an explanatory variable (in which SVR, R and NR are encoded to 0, 1 and 2 respectively) and expression level as the response variable. We tested the null hypothesis that the coefficient of the outcome is 0. Summary table of the p-value is also shown. NS shows no significant difference.

