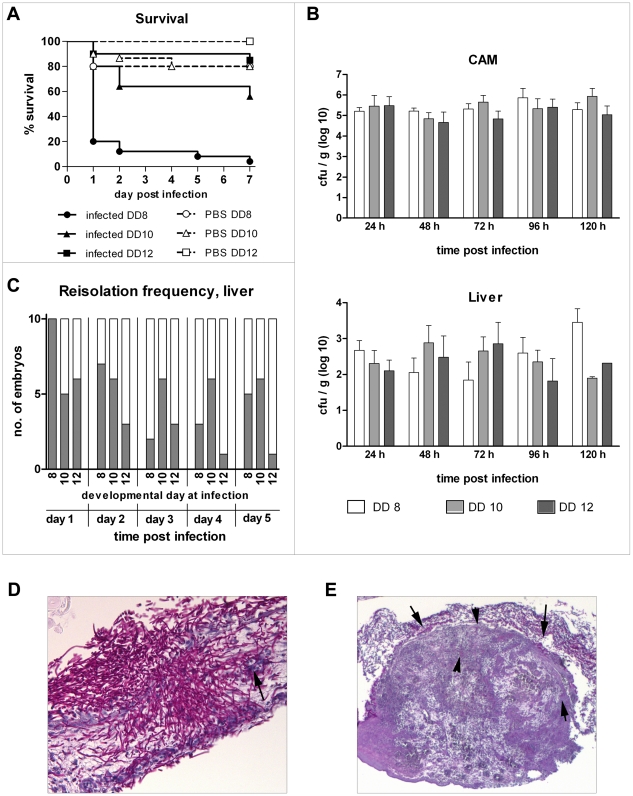
Figure 1. Characterization of the course of infection in chicken embryos infected with C. albicans SC5314 at different developmental days.
(A) Mortality after infection on the CAM (Kaplan-Meyer curve). N = 20 per group per experiment, two independent experiments. Significant mortality (compared to age-matched PBS control, log rank test) was only observed for embryos infected on developmental day (DD) 8 (P<0.01). The logrank test for trend was significant for comparison of infected groups (P<0.0001). (B) Comparison of fungal burden in CAM in embryos infected at different developmental days (DD) as mean and SD, n = 10. (C) Frequency of positive isolation of C. albicans from liver (n = 10 per DD and time point). Dark: positve isolation; white: no fungi isolated. (D and E) Histology of embryos infected on developmental day 10. Periodic acid-Schiff stain (fungal elements: pink). (D) Hyphae invading into and penetrating the full thickness of the CAM 24 h after infection. Arrow: blood vessel penetrated by C. albicans. (E) Histology of macroscopically visible plaque 3 days after infection. Arrows indicate fungal cells.

