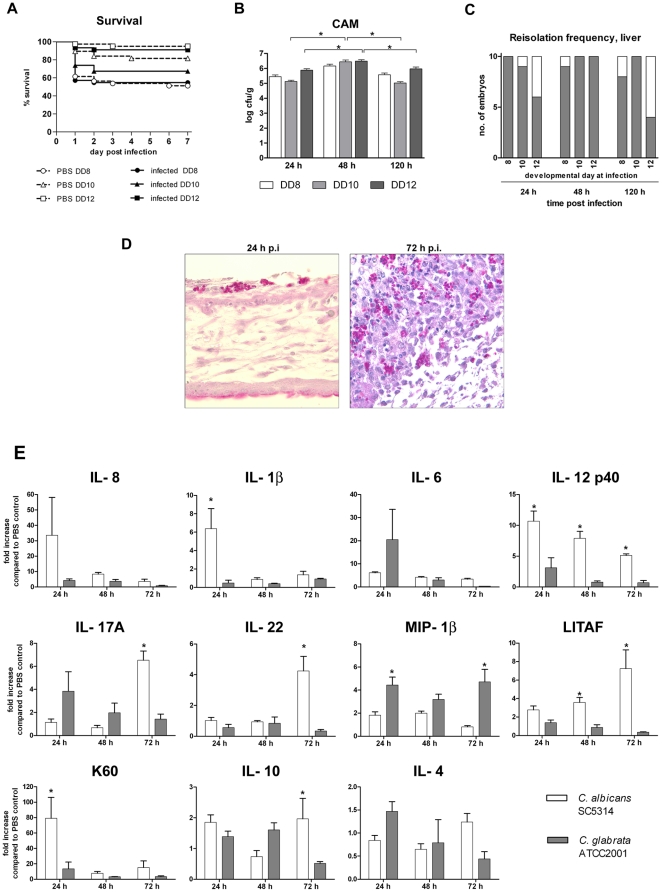
Figure 5. Characterization of the course of infection in chicken embryos infected with C. glabrata ATCC2001.
(A) Mortality after infection on the CAM (Kaplan-Meyer curve). N = 20 per group per experiment, two independent experiments. No significant mortality (compared to age-matched PBS control, log rank test) was observed, independent of the developmental day (DD) at infection. (B) Comparison of fungal burden in CAM, n = 10 per group, mean and SD. (C) Frequency of positive isolation in livers of embryos infected at different DD as mean and SD. Dark: positve isolation; white: no fungi isolated. (D) Representative histology of C. glabrata infected CAM. (E) Comparison of cytokine transcription in embryos infected with either C. albicans SC5314 (white) or C. glabrata ATCC2001 (grey) on DD10. N = 5 per time point, data is shown as mean and SD. Asterisks indicate statistically significant differences (P<0.05; 2-way ANOVA and Bonferroni post test).

