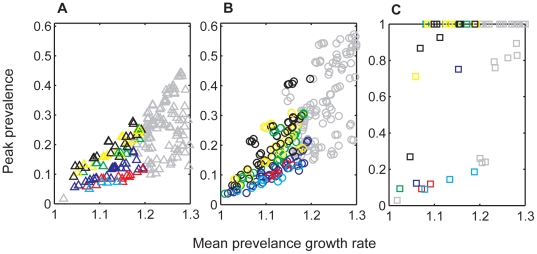
Figure 4. The relationship between peak prevalence and prevalence growth rate is modulated by prion persistence and the functional form of transmission.
The mean prevalence growth rate calculated as the average growth rate during the first 10 years of the CWD epidemic, is plotted against the peak prevalence reached over the course of the entire CWD epidemic for (A) density-dependent (ε = 0), (B) intermediate (ε = 0.0001), and (C) frequency-dependent (ε = 1) transmission scenarios that assume both direct and indirect transmission. Plots include simulations with aggregated (k = 0.01, 1) and non-aggregated (k = 10000) transmission risk. Prion persistence is represented by color (cyan = direct transmission only, red = 3 month half life (HL), dark blue = 1 yr HL, green = 4 yr HL, yellow = 6 yr HL, black = 8 yr HL). Gray symbols represent model simulations that were not considered plausible given the epidemic characteristics observed in Colorado, Wyoming, and Wisconsin. Note the scale difference in the y-axis between plots A, B, and C. See Table 1 for βd and βi values employed in these simulations.

