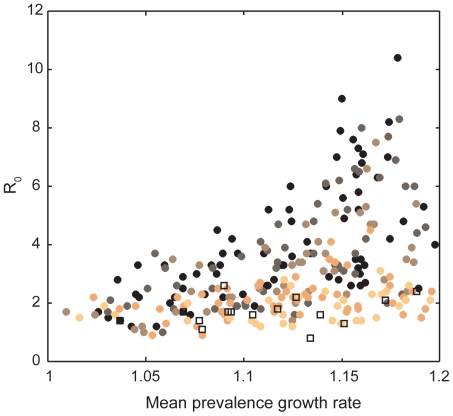
Figure 7. The basic reproductive number, R 0, as a function of the prevalence growth rate and prion persistence.
The mean prevalence growth rate is calculated as the average growth rate during the first 10 years of the CWD epidemic. Each point represents the average value for 10 simulations per unique combination of direct and indirect transmission rates, functional forms of transmission, aggregation, and prion persistence. Prion persistence ranges from low (lightest circles = 0.25 year half-life) to high (black circles = 8 year half-life). The empty squares represent values assuming only direct transmission. Plotted data represent only “plausible” simulation results. See Table 1 for βd and βi values employed in these simulations.

