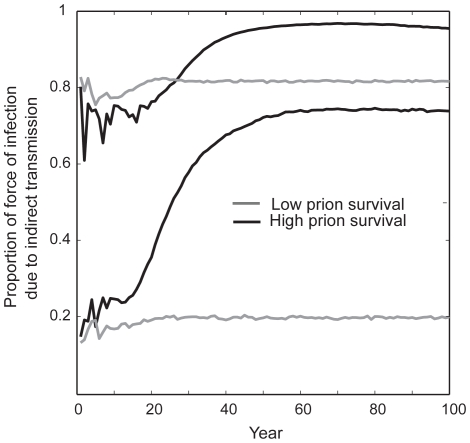
Figure 8. The proportion of the force of infection due to indirect transmission increases over time and varies with respect to prion survival.
Gray lines represent typical dynamics when prion survival is low (0.25 year half-life), whereas black lines represent typical dynamics when prion survival is high (8 year half-life). The two lines plotted for each value of prion survival represent the cases where the starting ratio of indirect: direct transmission is either high (upper gray line, βd = 7.5e−7; βi = 5.75e−8; upper black line, βd = 2.25e−6; βi = 1.75e−8) or low (lower gray line, βd = 2.5e−6; βi = 1.1e−8; lower black line, βd = 7.5e−6; βi = 7.5e−9). Although not displayed here, all ranges of starting ratios are possible, but the patterns for low versus high prion survival remain the same.

