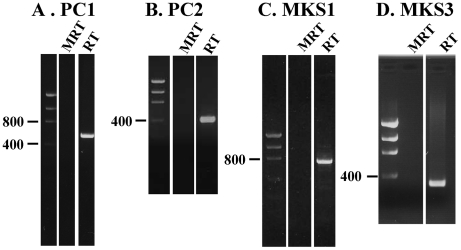
Figure 1. Proteins associated with renal cystic disease are expressed in the OE on the RNA level.
Each panel shows a low DNA mass ladder (Invitrogen 10068-013) as well as a MRT (Mock RT negative control) and RT (experimental) lane. In addition to the MRT control, primers were designed such that introns in the genomic DNA would ensure that size of amplified genomic DNA would be appreciably different from the reverse transcribed band. Figure 1A shows the presence of PC1 in the OE (expected: 577 nt, genomic: 1627 nt), 1B shows PC2 in the OE (expected: 406 nt; genomic: 3447 nt), 1C shows MKS1 (expected: 715 nt, genomic: 4516 nt) and 1D shows MKS3 (expected: 309 nt, genomic: 7968 nt). All bands were cloned and sequenced to confirm identity.

