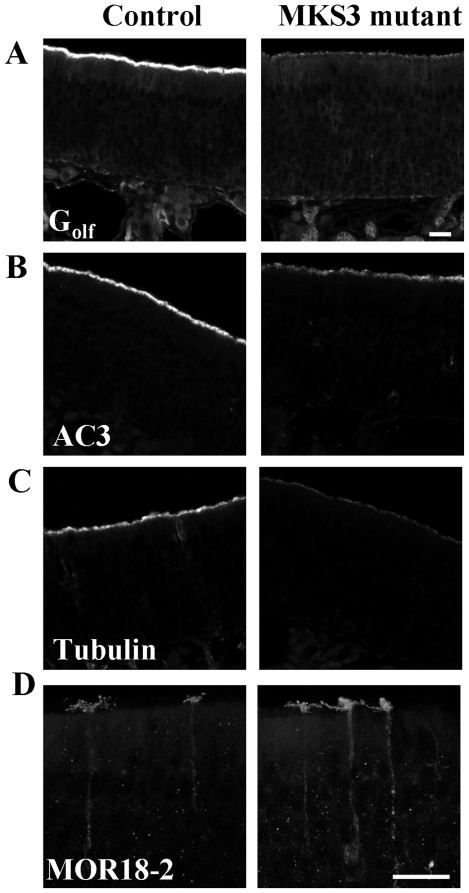
Figure 3. Expression and localization of olfactory proteins in the OE of MKS3 mutant rats.
Representative pictures demonstrating that rats homozygous for a point mutation in MKS3 have decreased Golf (A), AC3 (B), and α-acetylated tubulin (C; a ciliary marker) expression as compared to control rats. MOR18-2, however, appears to be expressed normally (shown in (D) as a compressed z-stack). Scale bar = 20 µm: shown in (A) for A–C, and in (D) for D.

