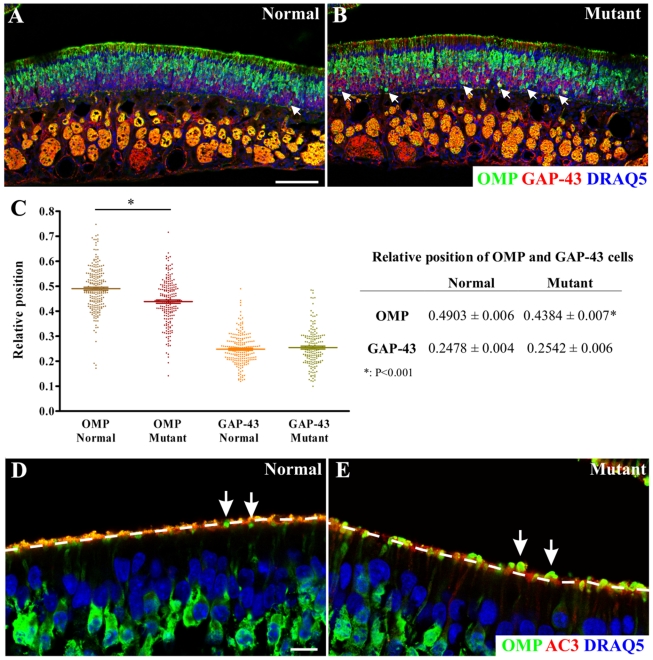
Figure 4. Altered distribution of OMP cells and abnormal dendritic knobs are observed in rats with a disease-causing point mutation in MKS3.
MKS3 mutant (B) sections stained with OMP (green) and GAP-43 (red) showed high numbers of OMP+ cells at the bottom of the OE (arrows) as compared to Control (A; nuclei are stained with DRAQ5 (blue)). C: Quantification of the relative position of OMP and GAP-43 expressing cells confirmed the unusual basally-oriented distribution of OMP cells in MKS3 mutant rats (ANOVA P<0.0001, Bonferroni post test values are shown in the table). There was no significant change in the relative position of GAP43 cells between genotypes. At a low magnification (as in A, B), the edge of the epithelium appeared to be continuous in the control animals (as shown by OMP staining), but had a discrete, interrupted staining pattern in the mutant animals. At higher magnification (D, E), this appears to be due to an increased frequency of OMP knobs (green) appearing to protrude “above” the ciliary layer (as defined by AC3 (red) staining, dashed line; nuclei are stained with DRAQ5 (blue)). Notice that OSN knobs appeared to be bigger in the mutant animals (arrows in D and E). Scale bars = 100 µm: shown in (A) for A & B; 10 µm: shown in (D) for D & E.

