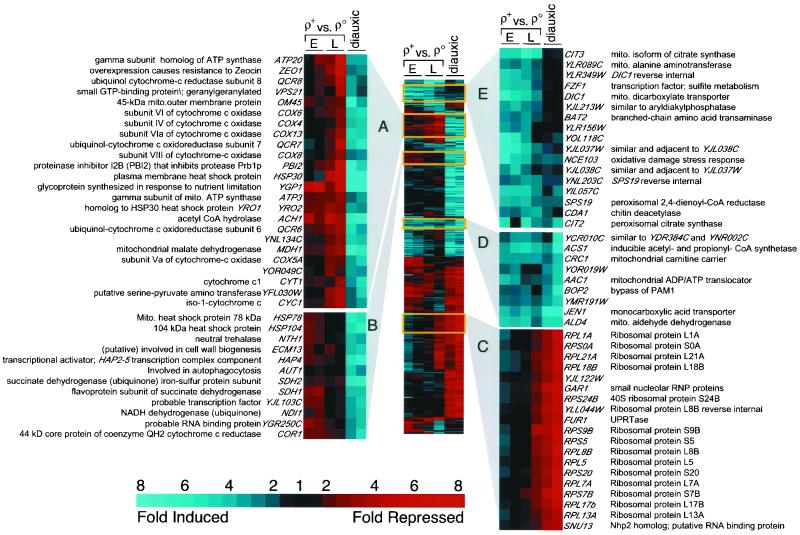
Figure 1.
2-D cluster analysis of gene expression in ρo versus ρ+ cells. The first four columns from left to right are replicate hybridizations of cDNAs prepared from early (E; OD600 = 0.5) and late (L; OD600 = 1.5) log phase cultures of ρ+ versus ρo cells differentially labeled with Cy3 and Cy5. Data from DeRisi et al. (1997) for the last two time points in the diauxic shift of glucose-grown ρ+ cells (OD600 = 6.9 and 7.3) are included in the last two columns on the right, indicated as diauxic. All 402 genes showing at least a threefold change in at least two hybridizations are shown. Blue denotes genes induced in ρo relative to ρ+ or induced during the diauxic shift, and red refers to repressed genes. Mito, mitochondrial; RNP, ribonucleoprotein; UPRT, uracil phosphoribosyl transferase.

