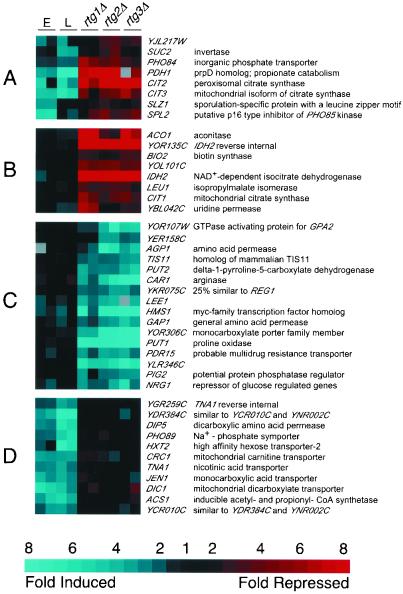
Figure 5.
Effects of RTG mutations in ρo cells. The four columns on the left are replicate comparisons of early (E) and late (L) log phase ρ+ and ρo cultures, as detailed in the legend to Figure 1. The six columns on the right are replicate comparisons of ρo cells and ρo cells containing deletions of rtg1, 2, or 3, respectively, and are based on cultures harvested at an OD600 = 0.8. (A–C) Genes whose expression is affected by RTG1, 2, and 3 in ρo cells. (D) A group of genes induced by respiratory deficiency in an RTG-independent manner. Blue refers to genes induced in ρo relative to ρ+ or induced in ρo rtg relative to ρo RTG. Red refers to repressed genes. All 273 genes that changed by at least threefold in at least two experiments are shown.

