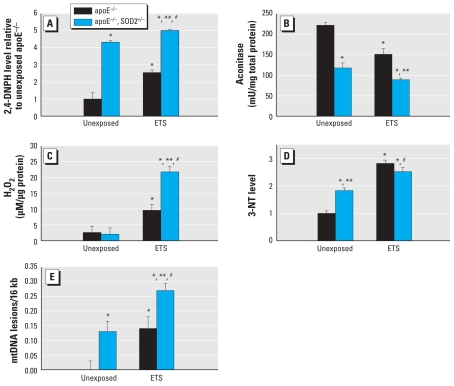
Figure 2.
Cellular and mitochondrial oxidative stress levels in apoE−/ − and apoE−/ −, SOD2+/− mice exposed to filtered air or ETS. Quantification of oxidized protein [2,4-dinitrophenylhydrazine (2,4-DNPH)] (A), aconitase activity (B), H2O2 (C), 3-NT (D), and mtDNA damage (E) in mice exposed to filtered air or ETS.
p < 0.05 compared with unexposed apoE−/ − mice. **p < 0.05 compared with exposed apoE−/ − mice. #p < 0.05 compared with unexposed apoE−/ −, SOD2+/− mice.

