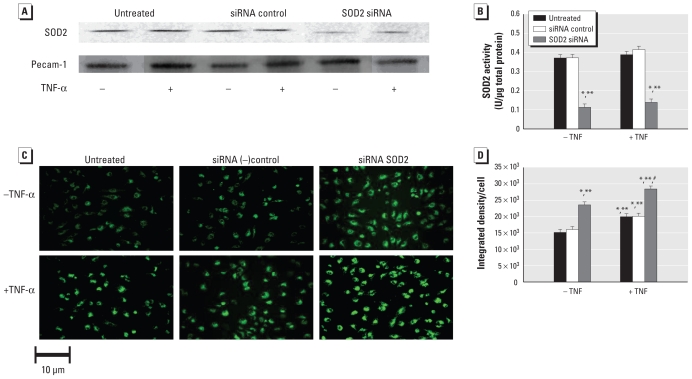
Figure 4.
TNF-α–induced oxidant production in HUVECs pretreated with sham (untreated), control (siRNA ctl), or SOD2 siRNA for 24 hr, followed by no treatment or by treatment with 30 ng/mL TNF-α for 30 min. (A) SOD2 and platelet-endothelial cell adhesion molecule (Pecam-1) levels. (B) SOD2 activity. Assessment (C) and quantification (D) of rhodamine 123 fluorescence.
*p < 0.05 compared with untreated cells. **p < 0.05 compared with siRNA controls. #p < 0.05 compared with all other groups.

