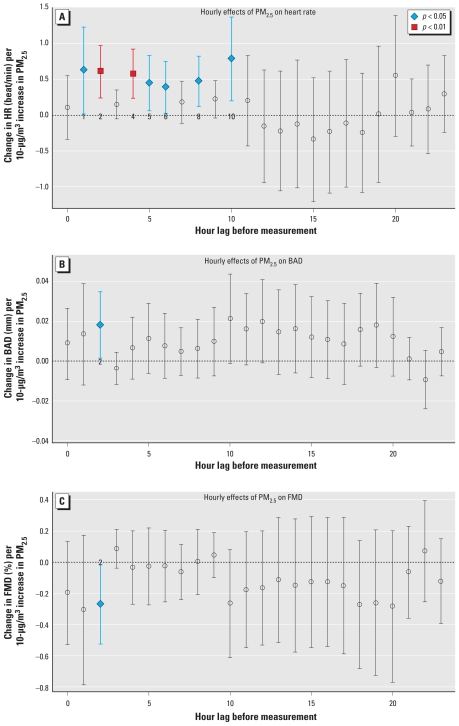
Figure 1.
Associations of hourly TPE levels with CV outcomes according to the lag period of exposure: personal PM2.5 and HR (A), BAD (B), and FMD (C). The x-axis is the period of time (hour lag) before the measurement of the CV outcome; hour 0 = period from 0–60 min before the CV measurement. Points indicate the multivariate-adjusted CV outcome association (β-coefficient per 10-μg/m3 increase in TPE ± 95% confidence intervals) for each hourly time point from the linear mixed model 1. Colored data points indicate statistically significant time points.

