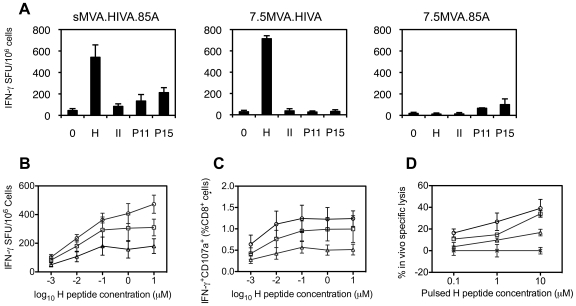
Figure 3. Induction of HIV-1- and M. tuberculosis-specific T cell responses.
(A) Groups of 4 BALB/c mice were immunized with 107 PFU i.m. of either 7.5MVA.HIVA, 7.5MVA.85A or sMVA.HIVA.85A, sacrificed 2 weeks later and splenocytes from individual mice were analyzed for IFN-γ production following peptide stimulation. Data are represented as means ± SD. (B–C) Groups of 4 BALB/c mice were immunized i.m. with 105 PFU of either 7.5MVA.HIVA (triangles), mMVA.HIVA.85A (circles) or sMVA.HIVA.85A (squares) vaccines. Two weeks later, mice were sacrificed and the ability of splenocytes from individual animals to respond to increasing amounts of peptide H was assessed in an IFN-γ ELISPOT (B), ICS (C) and in vivo killing (D) assays. Mean ± SD are shown. Only stimulation with 1 µM H peptide in an IFN-γ ELISPOT assay provided a statistically significant difference (p = 0.04) between frequencies induced using the mH5 and ssp promoters.

