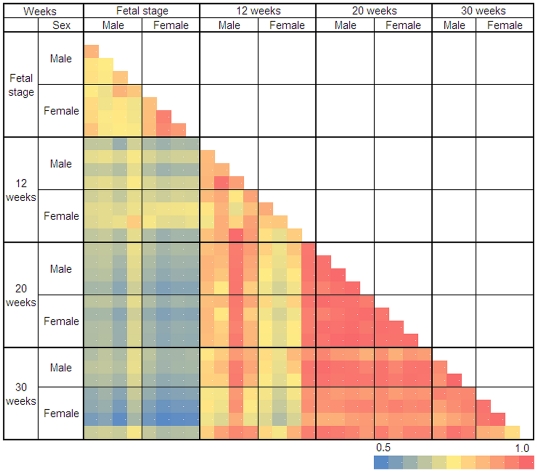
Figure 2. Correlation matrix of age-related gene expression.
This color-coded correlation matrix illustrates pairwise correlations between the levels of gene expression in individuals. Probe sets with normalized signals (log-transformed and scaled) were used to calculate correlations between 31 arrays using Pearson correlation coefficient; signals flagged as “absent” were excluded.

