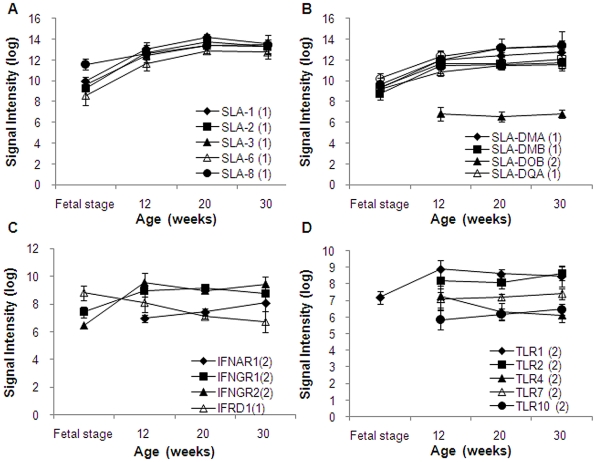
Figure 5. Signal intensity of major histocompatibility complex (MHC) genes.
(A) Swine leukocyte antigens (SLA) classical class I genes. (B) Swine leukocyte antigens (SLA) classical class II genes. (C) Interferon receptor genes. (D) Toll-like receptor (TLR) genes. Signal intensities were normalized using quantile normalization and log-transformed after excluded signals flagged as “absent.” The category numbers are shown in graph legends. Genes in Categories 1, 2, and 4 are shown in the graph.

