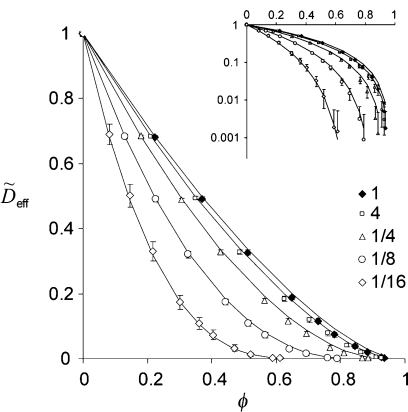
Figure 2.
The data of Fig. 1 plotted vs excluded volume fractions, ϕ. Solid lines are graphs of fα,ϕc(ϕ)=(1−ϕ∕ϕc)αϕc with the corresponding values of α and ϕc. The error bars are not shown if they are comparable to symbol sizes. Inset: a semilog plot of the same data.

