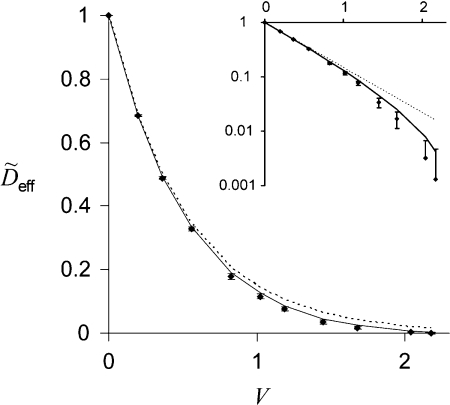
Figure 3.
Values of obtained for oblate spheroids with χ = 1/8 by homogenization method, plotted as a function of the obstacle volume density V. Solid and dashed curves are the plots of fα,ϕc(ϕ(V))=(1−ϕ(V)∕ϕc)αϕc and gα(ϕ(V)) = (1 − ϕ(V))α = e−αV, respectively; α = 2.699 and ϕc = 1 − exp ( − 5/α). The error bars are comparable to the symbol size. Inset: a semilog plot of the same data.

