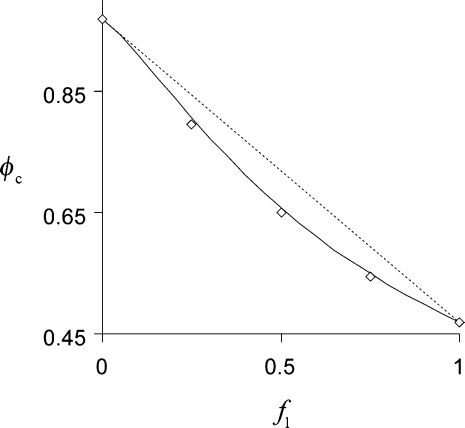
Figure 4.
Percolation thresholds ϕc for mixtures of spheres (χ1 = 1) and oblate spheroids (χ2 = 1/32), as a function of the phase fraction of spheres, f1 (diamonds). The error bars are smaller than the symbol size. The data, obtained using the “burning” algorithm, are well approximated by Eq. 8 (solid curve); the dashed line represents the linear function ϕc = ϕc, 1f1 + ϕc, 2(1 − f1).

