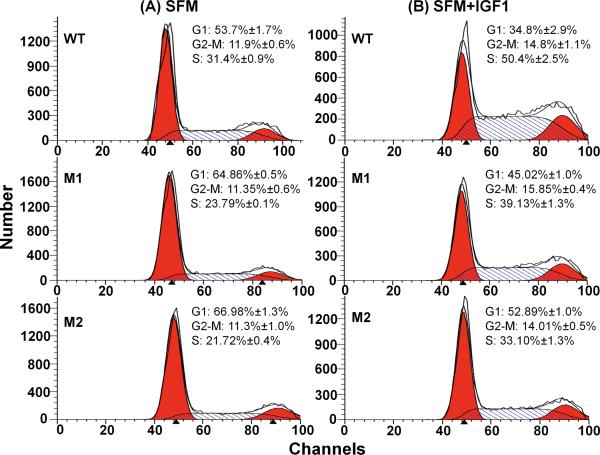
Fig. 2.
Cell cycle profiles of MEFs expressing the different human IGF1R in Igf1r− MEFs; WT: wild type, M1: A37T, M2: R407H. (A) Control incubation in serum free medium (SFM). (B) Cells cultured in serum free medium for 24 h followed by 24 h incubation with 10nM IGF1 (SFM+IGF1). Cells were fixed, permeablized, and stained with propidium iodide to measure DNA content by fluorescence-activated cell sorting (FACS) analysis. The mean percentages of cells ±SEM in each phase of the cell cycle are indicated with representative profiles from WT, M1, and M2 mutations, n=3.

