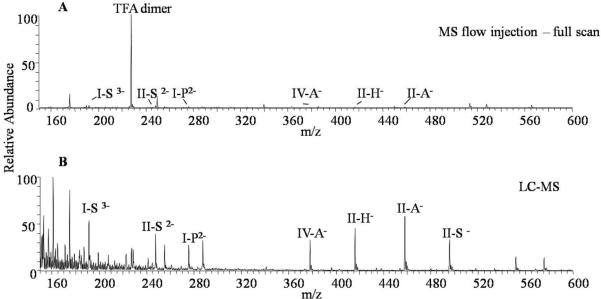
Figure 1.
Comparison of MS flow injection and LC-MS analysis of a sample of six disaccharide standards (I-S, II-S, IV-A, II-H, II-A and internal standard I-P) in human serum matrix after SPE cleanup: (A) MS full scan spectrum shows a significant TFA dimer ion suppression; (B) LC-MS spectrum shows much better signals of disaccharides.

