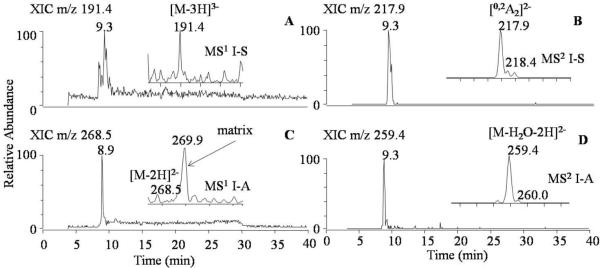
Figure 2.
Comparison of the extracted ion chromatographs (XIC) from the MS1 and MS2 spectra: (A) XIC of I-S3- ([M-3H]3- at m/z 191.4) in MS1 spectrum (shown as an inset); (B) XIC of the diagnostic ion ([0,2A2]2- at m/z 217.9) of I-S in MS2 spectrum (shown as an inset); (C) XIC of I-A2- ([M-2H]2- at m/z 268.5) in MS1 spectrum. The inserted MS1 spectrum shows I-A ion and a matrix peak (m/z 269.9) that partially overlapped with I-A; (D) XIC of the diagnostic ion ([M-H2O-2H]2- at m/z 259.4) of I-A in MS2 spectrum (shown as an inset).

