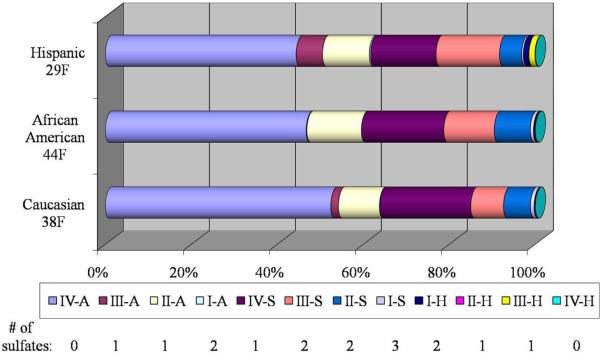
Figure 4.
Bar graph of the compositions of the 12 heparin/HS-derived disaccharides from three single donor sera, 38 years old Caucasian female (Caucasian 38F), 44 years old African American female (African American 44F) and 29 years old Hispanic female (Hispanic 29F). The 12 disaccharides are shown in different colors as legend list below and the length of each color represents the percentage composition of the represented disaccharide. The number of sulfate groups in each 12 disaccharide is listed under the color legend accordingly.

