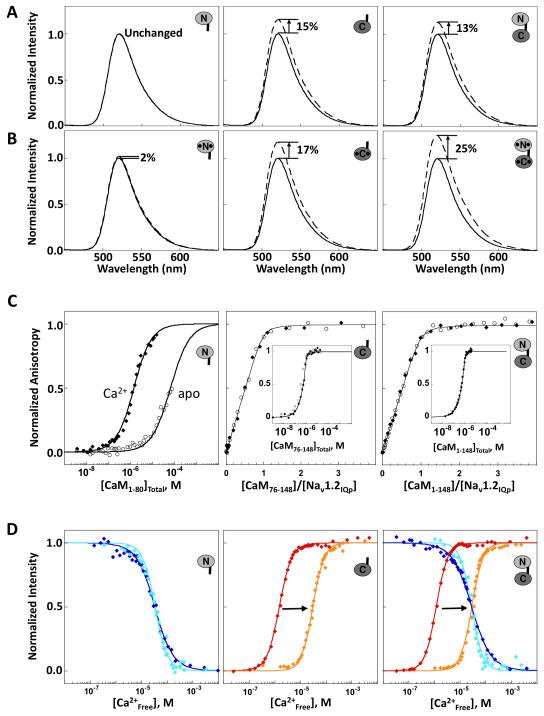
Figure 2. Domain-specific Interactions of CaM with Nav1.2IQp.
Emission spectra of Fl-Nav1.2IQp in the absence (solid line) and presence (dashed line) of slight excess of (A) apo CaM1-80 (left), apo CaM76-148 (middle), and apo CaM1-148 (right) or (B) Ca2+-saturated CaM. C: Titration of Fl-Nav1.2IQp with apo CaM (open circles) or Ca2+-saturated CaM (filled diamonds). The titrations of apo CaM1-80 were normalized to the maximum signal observed after addition of 10 mM CaCl2 (Newman, 2008). For CaM76-148 (middle), and CaM1-148 (right), binding was stoichiometric and is plotted as a function of the ratio of [CaMtotal]:[peptide], with an inset showing saturation versus [CaMtotal]. D: Equilibrium Ca2+ titrations of CaM1-80 (left), CaM76-148 (middle), and CaM1-148 (right) using intrinsic fluorescence to monitor Ca2+ binding in the absence of peptide [sites I and II (blue) or sites III and IV (red)], or after addition of excess Nav1.2IQp [sites I and II (cyan) and sites III and IV (orange)]. Supported by Tables S1 and S2.

