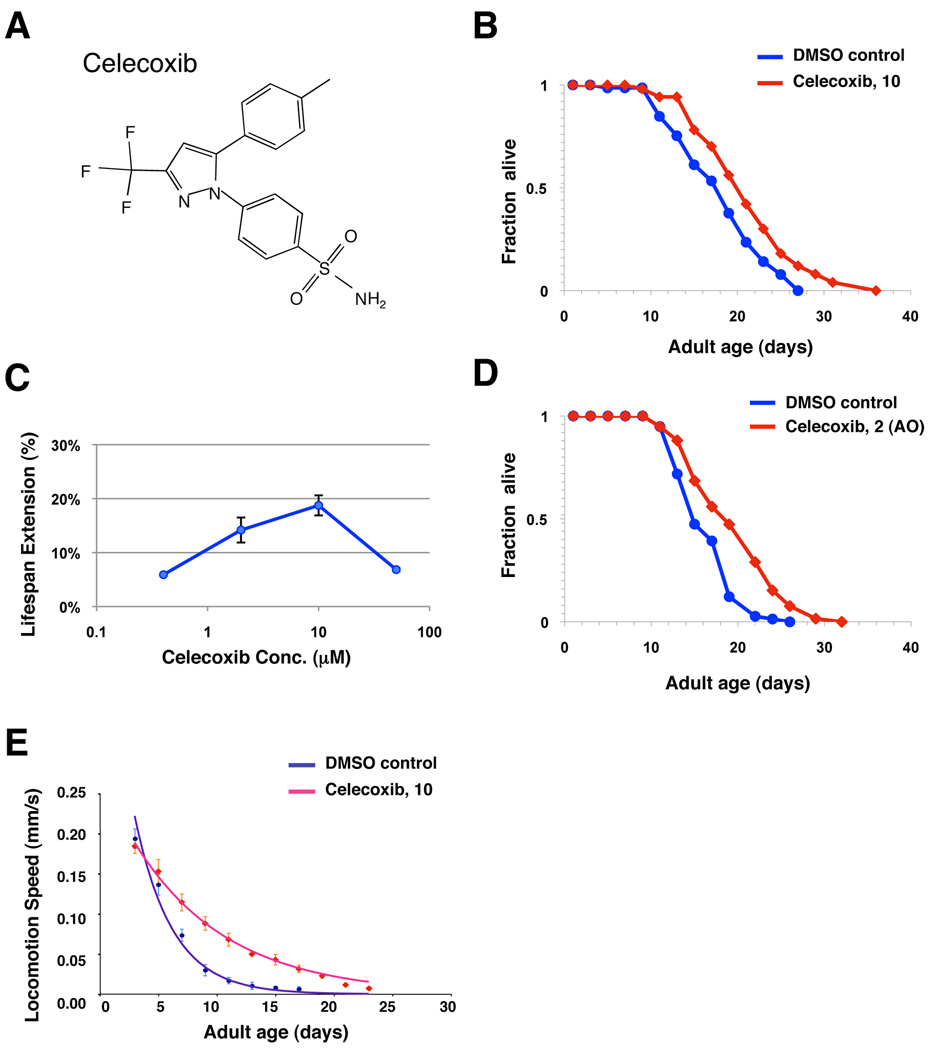
Figure 1. Celecoxib extends adult lifespan and delays age-associated physiological changes.
(A) Chemical structure of celecoxib. (B) Survival curves of wild-type (N2) animals treated with either DMSO control (blue) or 10 µM of celecoxib (red). The treatments were initiated from the time of hatching and continued until death. Statistical details and repetition of this experiment are summarized in Table S1. (C) Dosage-response analysis of celecoxib (Cbx). Wild-type (N2) animals were exposed to DMSO control or 0.5, 2, 10, and 50 µM celecoxib. The average percentage change in lifespan of at least two independent experiments was plotted as a function of dosage. Statistical details and repetition of this experiment are summarized in Table S1. (D) Survival curves of wild-type (N2) animals exposed to an adult-only treatment of either DMSO control (blue) or 2 µM of celecoxib (red). The treatments were initiated from the first day of adulthood and continued until death. (E) The speed of spontaneous locomotion of wild-type (N2) animals treated with either DMSO control (blue) or 10 µM of celecoxib (red). Locomotion speed was quantified every other day until death as previously described (Hsu et al. 2009), and the mean locomotion speed of these worms was plotted as a function of age. Error bars represent SD. Locomotion speed decayed throughout lifespan and can be best fitted by first-order exponential decay, and the rate of the decay (DMSO control, rate = 0.2686, R2 = 0.9623; celecoxib, rate = 0.1179, R2 = 0.9931) was calculated using the method previously described (Hsu et al. 2009).

