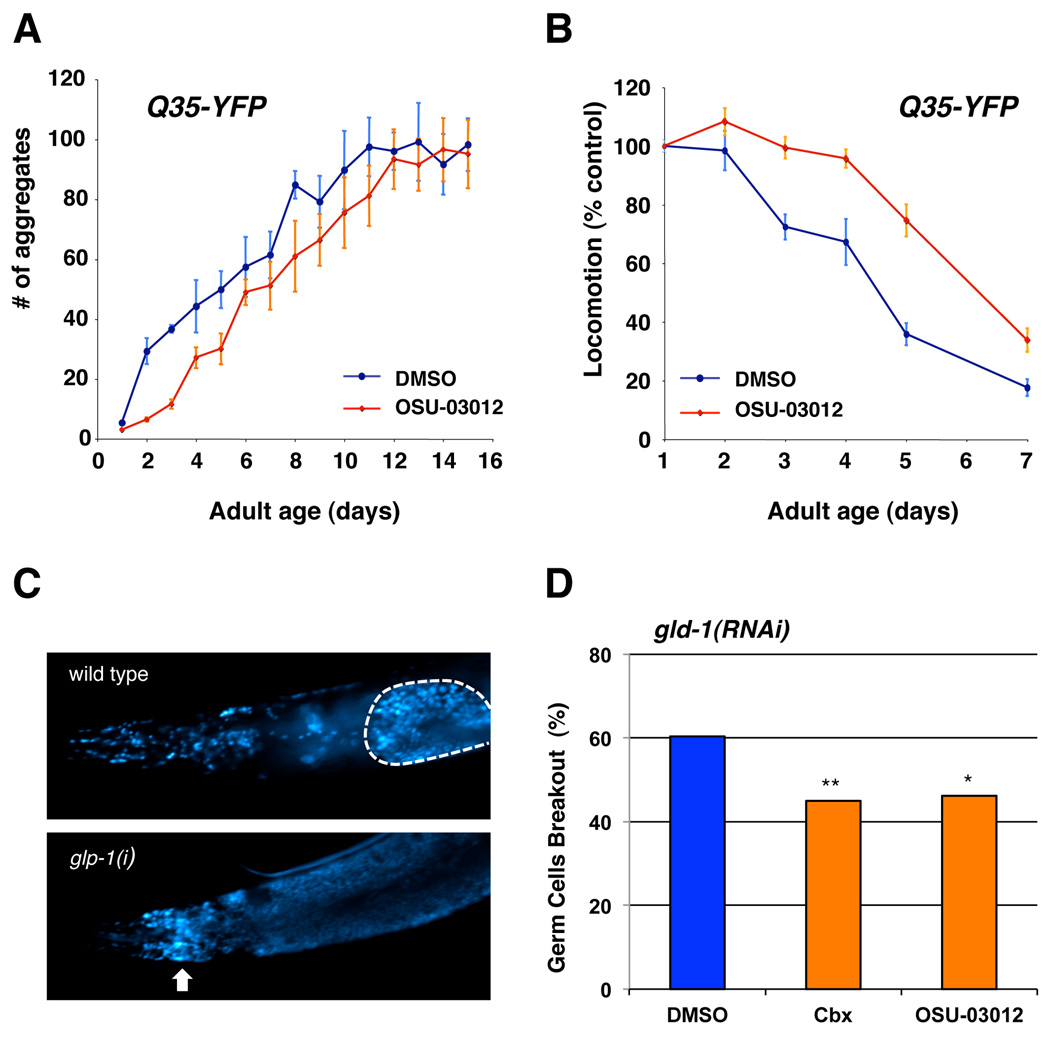
Figure 7. OSU-03012 delays the progression of age-related diseases.
(A) OSU-03012 delays the accumulation of polyQ aggregates. The number of polyQ aggregates in Q35 animals treated with DMSO control (blue) or 0.5 µM of OSU-03012 (red) were scored and plotted as a function of age. 10–15 worms were randomly selected from a pool of > 200 worms under each condition, and counted for aggregates every day. Data are mean ± SD. (B) Relative locomotion speed of Q35 animals treated with DMSO control (blue) or 0.5 µM of OSU-03012 (red). Locomotion speed was quantified every day as previously described, and the mean locomotion speed was plotted as a function of age. Data are mean ± SD as a percentage of day 1 DMSO control. (C) Images of day 6 adult wild types (left panel) or gld-1(RNAi) (right panel) animals stained with the DNA-intercalating dye DAPI (4’,6’-diamidino-2-phenylindole) using standard method. The gonad of wild-type animal was outlined by white dashed line. The white arrows indicate the presence of undifferentiated germ cells outside of the gonad in gld-1(RNAi) mutants. (D) Worms exposed to DMSO control, 10 µM celecoxib, or 0.5 µM OSU-03012 from hatching were scored for the presence or absence of undifferentiated germ cells outside of the gonad as shown in the right panel of (C) at day 6 of adulthood (n ≥ 125 for each treatment). The percentage of animals with undifferentiated germ cells found in the head is plotted here. Each bar represents combined data of 2–4 independent experiments per condition. Mean ± S.D. = 60.4 ± 3.3, 45.0 ± 1.7, and 46.2 ± 2.6 for DMSO, cbx, and OSU-03012, respectively. Asterisks indicate significant changes (**, P < 0.005, *, P < 0.05). P values were calculated by Pearson's chi-square test.

