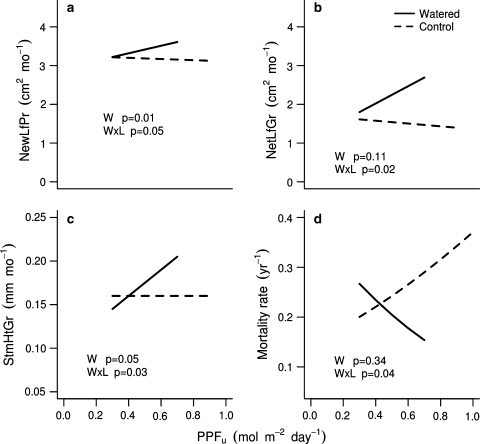
Fig. 3.
The effect of water addition on the light response of seedlings planted in the dry site. Lines represent the mean response for all species combined: a new leaf production (NewLfPr), b net leaf growth (NetLfGr), c stem height growth (StmHtGr) and d mortality. The mean response was determined using mixed-effects models (linear for growth and logistic for mortality) for uncaged seedlings only. The length of the line represents the range of light levels for each set of plots. In a and b, the line at zero is for reference. The P values in the panels represent the significance of the main effect of watering (W) on seedling performance and the water × light interaction (W × L). See Table 2 for relevant statistics

