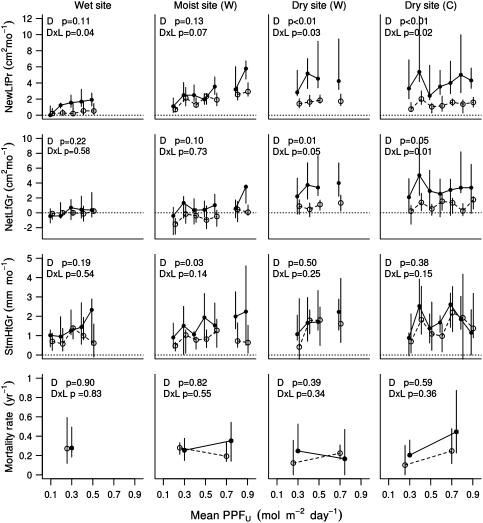
Fig. 4.
Comparison of the performance of wet- (filled circle) versus dry- (open circle) distribution species grown at different understory light levels in wet, moist and dry sites, with (W) and without water supplementation (C). The symbols represent the medians, and vertical bars represent the inter-quartile range for each group of species at each light category. To improve legibility, plots with similar light levels were combined by averaging seedling performance within species. For mortality rates, we used only two light categories: less than and more than 0.5 mol m−2 day−1. Only data for uncaged seedlings are reported. The P values in the panels represent the significance of the main effect of distribution on seedling performance (D) and the distribution × light interaction (D × L), using linear mixed-effect models for the growth variables and Cox models for mortality

