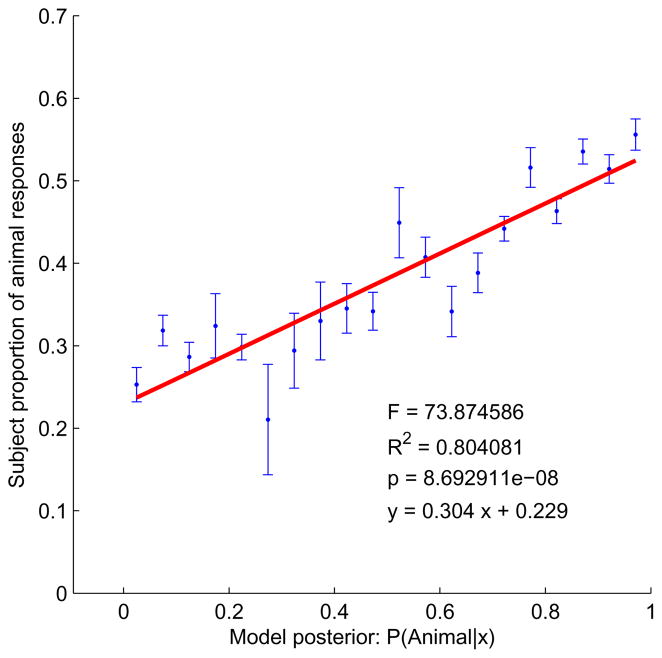
Figure 13.
Fit of the Bayesian skeletal classifier to human responses, Exp. 2. The plot shows proportion animal responses as a function of the animal posterior. Shapes with similar posteriors have been binned so that the proportion of animal responses could be calculated. Bins with only a single shape have undefined standard error so no error bar is shown.

