
Figure 11.
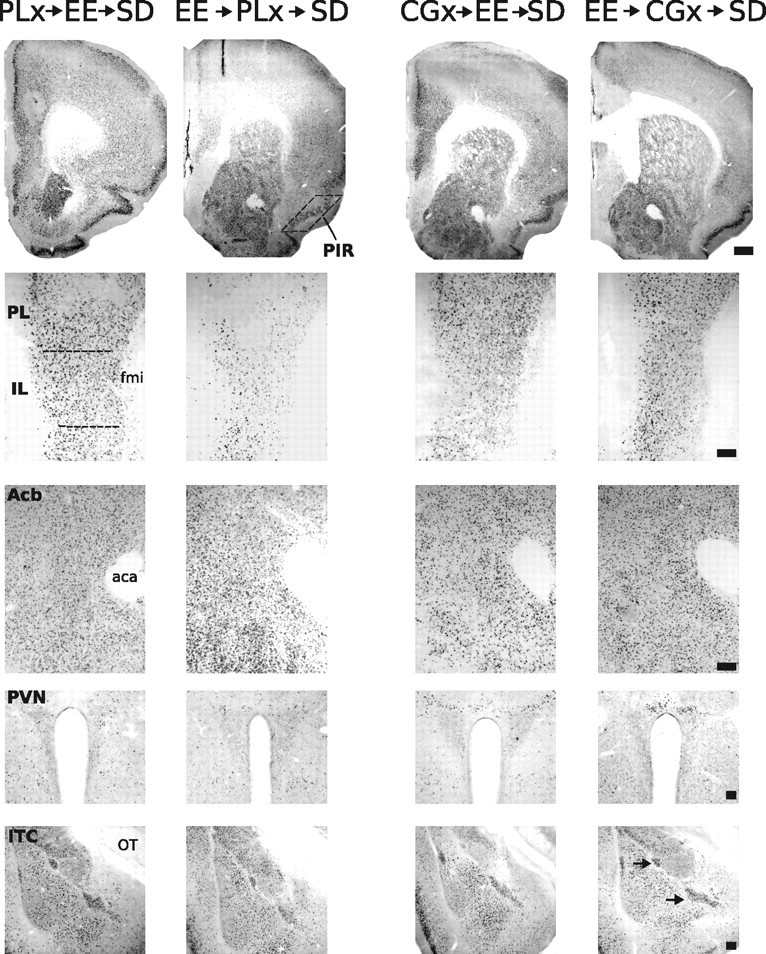
Representative photomicrographs of FosB/ΔFosB immunoreactivity within six brain areas that show comparative differences between defeated mice that received CG or PL lesions before enrichment (CGx→EE→SD or PLx→EE→SD, respectively) and defeated mice that received CG or PL lesions after enrichment (EE→CGx→SD or EE→PLx→SD, respectively). Dashed lines indicate templates within which counts were made. Black arrows point to ITC. For abbreviations, see Figure 2 legend. Scale bars: 400 and 100 μm for low- and high-magnification photographs, respectively.