
Figure 2.
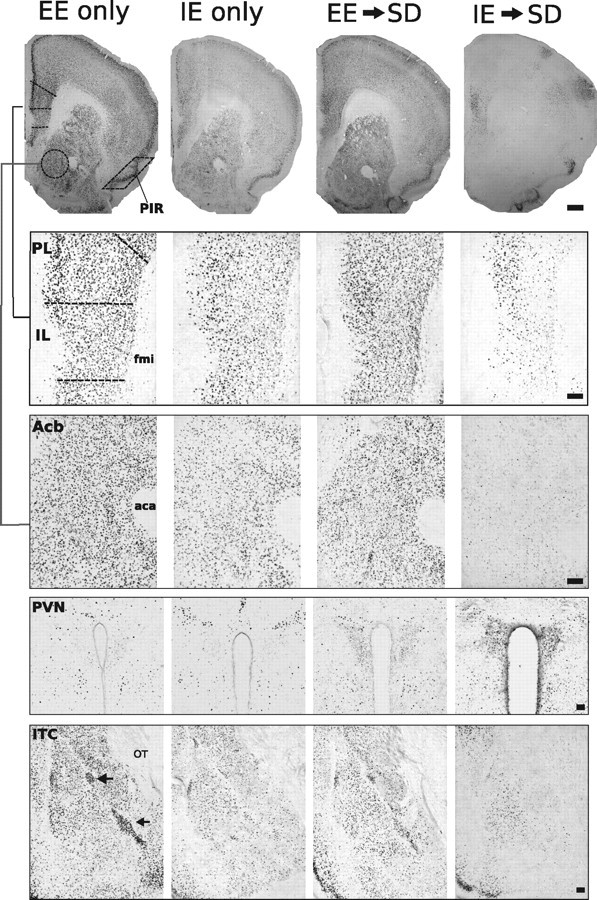
Representative photomicrographs of FosB/ΔFosB immunoreactivity within six brain areas showing comparative differences between non-defeated EE or IE-only home-cage mice and defeated mice previously housed in EE or IE. Dashed lines indicate templates within which counts were made. Black arrows point to ITC. aca, Anterior commissure, anterior limb; fmi, forceps minor corpus callosum; OT, optic tract. Scale bars: 400 and 100 μm for low- and high-magnification photographs, respectively.