
Figure 8.
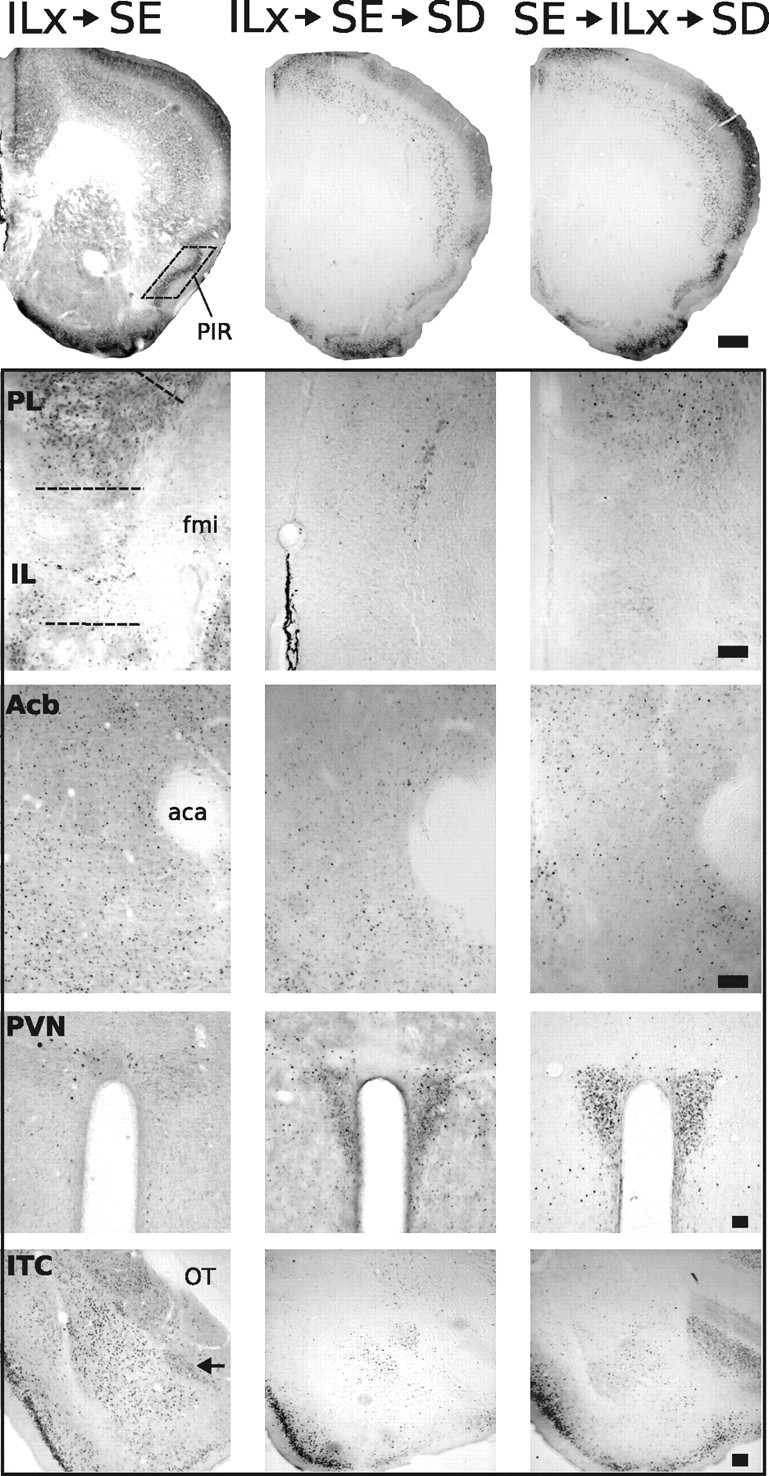
Representative photomicrographs of FosB/ΔFosB immunoreactivity within six brain areas that show comparative differences between non-defeated mice that received IL lesions before SE (ILx→SE) and defeated mice that received IL lesions before (ILx→SE→SD) or after (SE→ILx→SD) standard environmental housing. Groups exposed to SD (ILx→SE→SD and SE→ILx→SD) show diminished FosB/ΔFosB immunostaining in prefrontal cortical regions and enhanced FosB/ΔFosB immunostaining in the PVN compared with non-defeated groups (ILx→SE). Dashed lines indicate templates within which counts were made. Black arrows point to ITC. For abbreviations, see Figure 2 legend. Scale bars: 400 and 100 μm for low- and high-magnification photographs, respectively.