
Figure 1.
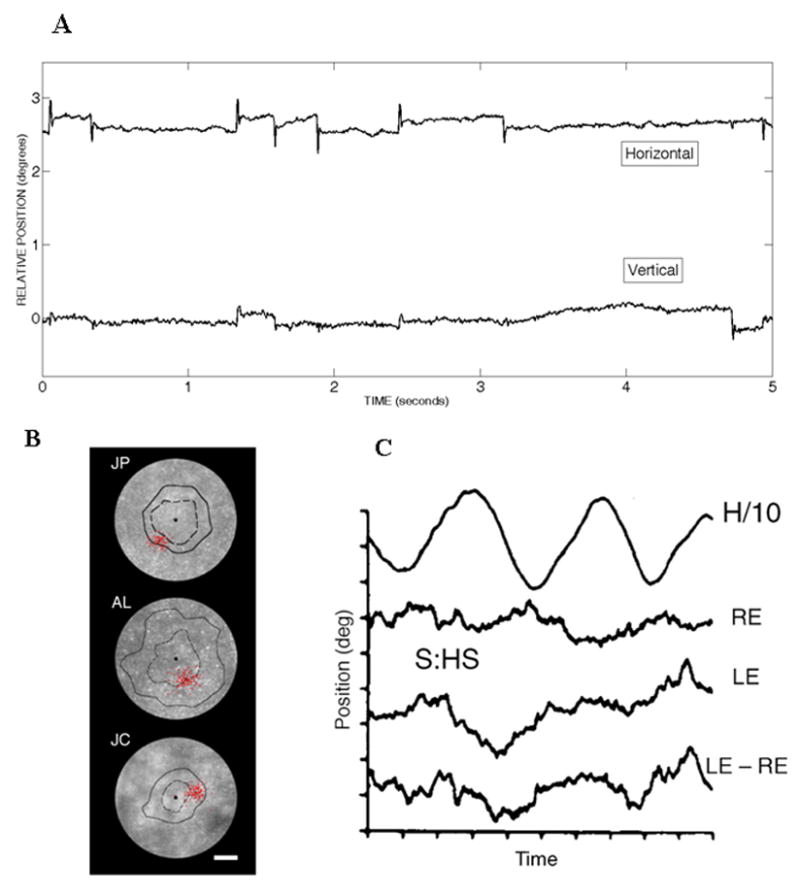
(a) Eye movements during fixation of a stationary point target recorded with the Dual Purkinje Eyetracker. (b) Retinal montages of the foveal cone mosaic for three subjects. The black square represents the foveal center; the dashed black line is the isodensity contour line representing a 5% increase in cone spacing, and the solid black line is the isodensity contour line representing a 15% increase in cone spacing. Red dots are individual fixation locations. Scale bar is 50 μm. NM Putnam, HJ Hofer, N Doble, L Chen, J Carroll, DR Williams (2005) The locus of fixation and the foveal cone mosaic. Journal of Vision, 17: 5(7), 632–639. Figure 1. (c) Eye movements during fixation while the head is rotating. Traces show movements of head, right eye, left eye, and vergence (right eye – left eye). Image velocities were the same as the eye traces. From R. Steinman & H Collewijn (1980) Binocular retinal image motion during active head rotation. Vision Research, 20, 415–429; Fig. 1.