
Figure 5.
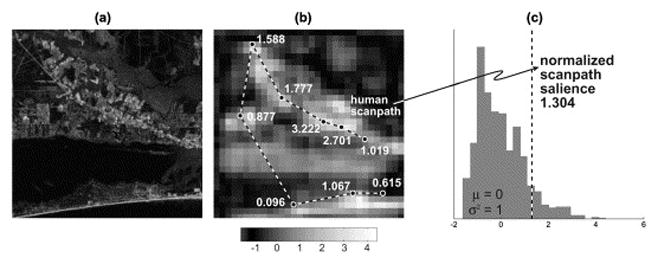
Illustration of a comparison of eye fixation positions (dashed lines, middle panel) with computed salience levels (numbers next to fixation locations, middle panel) during inspection of the image shown in the left panel. The right panel shows average computed salience values for all locations in the image. The dashed line is the average computed salience level of the fixated locations. From R.J. Peters, A. Iyer, L. Itti & C. Koch (2005) Components of bottom-up gaze allocation in natural images. Vision Research, 45, 2397–2416. (fig. 7)