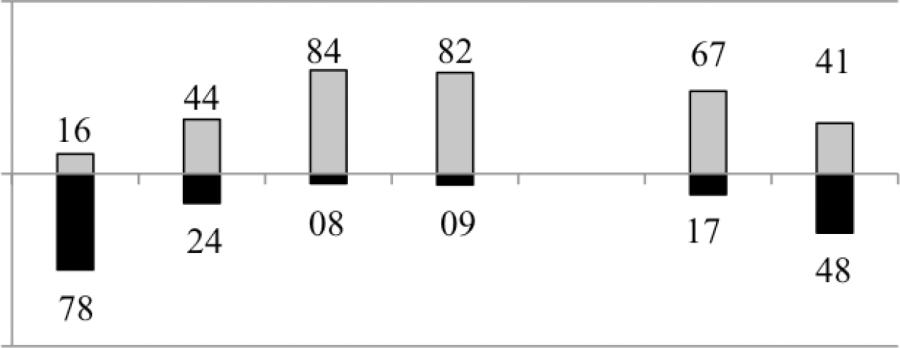
Table 3.
Percentage of Roles Reported by Individual Personalities in each Type of Dyad, and for Gender
| Domain |
Role |
Personality |
Gender |
||||
|---|---|---|---|---|---|---|---|
| I-Ia |
I----------E |
E-E |
F |
M |
|||
| (n = 38)% | (n = 25)% | (n = 25)% | (n = 44)% | (n = 76)% | (n = 56)% | ||
| Locale |

|

|
|||||
| Energy |

|

|
|||||
| Outsiders |

|

|
|||||
| Dialog |

|

|
|||||
| Content |

|

|
|||||
| Intimacy |

|

|
|||||
Note: Percentages may not sum to 100% because of No Mentions. For example, in the matched Introvert dyads, the two Locale roles sum to 87%, indicating 13% No Mentions in the interviews.
I = Introvert; E = Extravert
