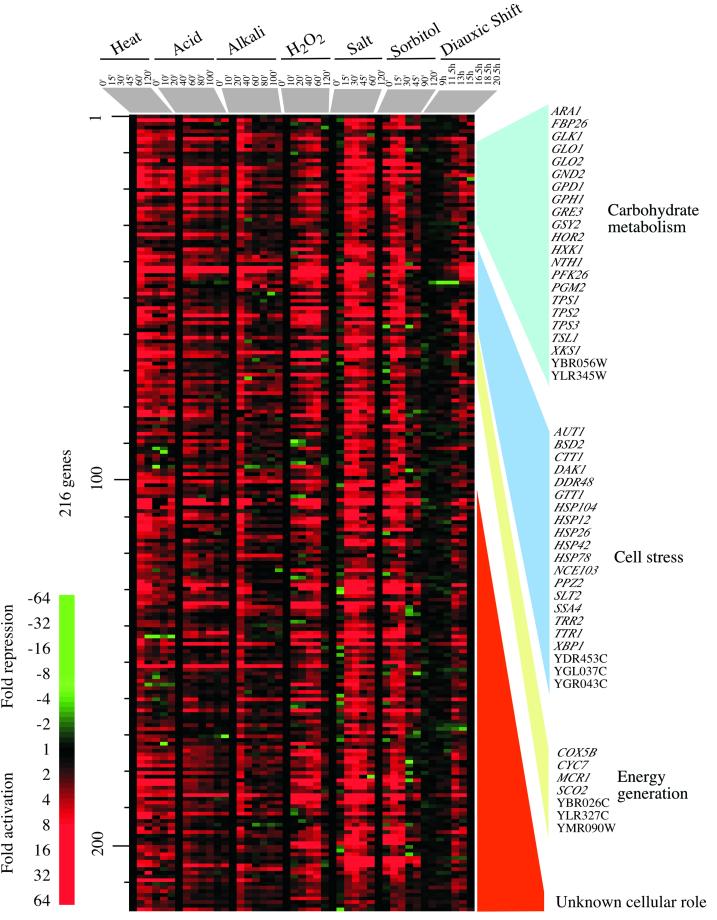
Figure 2.
A CER: gene activation. One of the clusters from the hierarchical tree in Figure 1, containing genes whose expression is induced in most of the environmental responses, is represented. These data were sorted so that genes with similar cellular functions, as listed in the Yeast Proteome Database (http://www.proteome.com), are listed together. Details are as described in the legend to Figure 1.

