
Fig. 2.
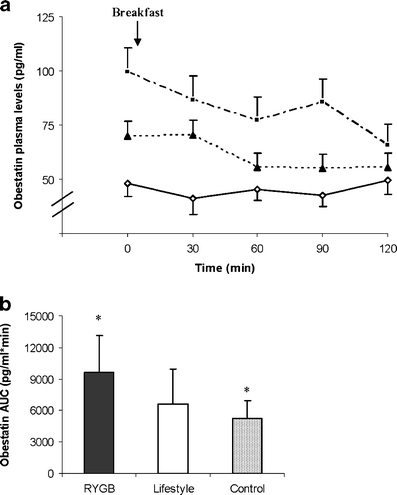
a Obestatin plasma levels (picograms per milliliter) over time after breakfast in pre-operative morbid obese patients (n = 9; open diamonds) and patients three years after RYGB (n = 9; closed squares) or a lifestyle intervention (n = 8; closed triangles). Values represent means ± SEM. Repeated-measures ANOVA showed a significant effect of time (P < 0.05) and group (P < 0.05) and a time × group interaction (P < 0.01). b Area under the curve for obestatin (0–120 min; picograms per milliliter per minute) in pre-operative morbidly obese patients (hatched bar) and patients 3 years after RYGB (solid bar) or a lifestyle intervention (open bar). ANOVA showed an overall main effect of group on obestatin AUC (P = 0.007). Asterisk reveals significant differences between groups (P = 0.01)