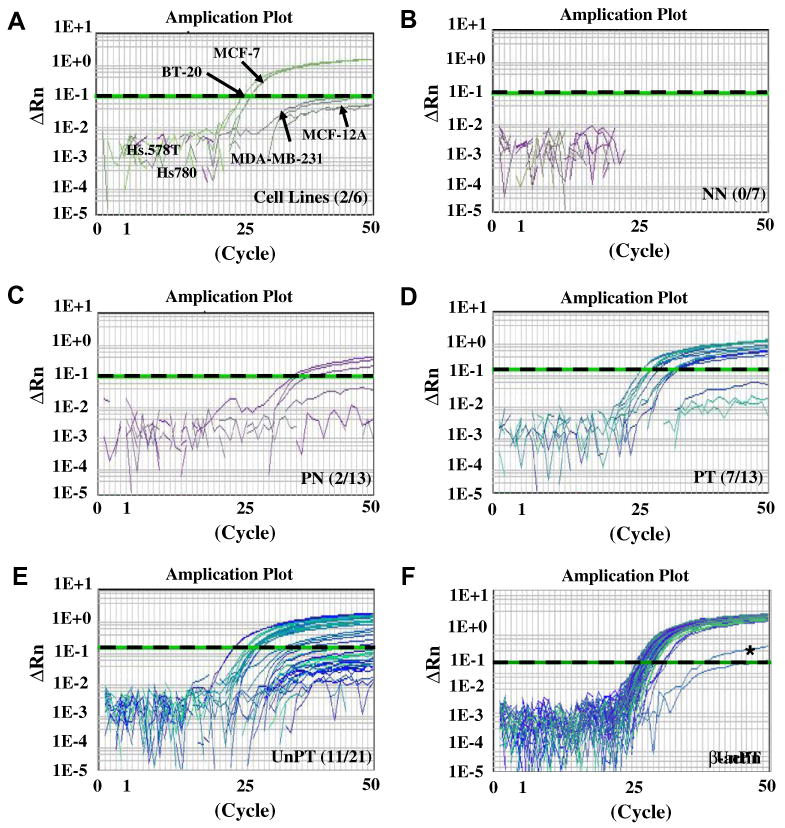
Fig. 2.

Promoter hypermethylation of DFNA5 in breast cancer. DFNA5 methylation was investigated by TaqMan-MSP analysis. Real-time-MSP curves in breast cell lines (A), NN (B), PN (C), PT (D), and UnPT (E) were generated. A threshold (1.0) was chosen at the ΔRn level to discriminate methylated and unmethylated DFNA5 DNA (dash line). Number of samples that were over the threshold is indicated in each plot. Amplification curves of β-actin in all samples tested is shown in (F).
