
Fig. 3.
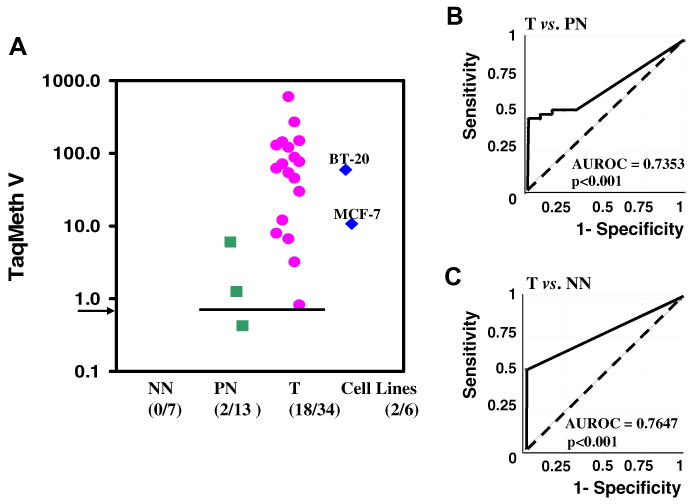
Quantitative level of DFNA5 promoter methylation. (A) The scatter plot of TaqMeth V of DFNA5. Arrow, a cut-off value of 0.81. Samples with a ratio equal to zero could not be plotted correctly on a log scale, so are presented here as 0.001. TaqMeth V is described in Materials and methods. (B,C) ROC curves of DFNA5 methylation for the detection of breast cancer. The optimal cut-off (value, 0.81) was calculated from the ROC curve (T vs. PN) in order to determine the frequency of DFNA5 methylation. Solid line, DFNA5; dash line, no discrimination.