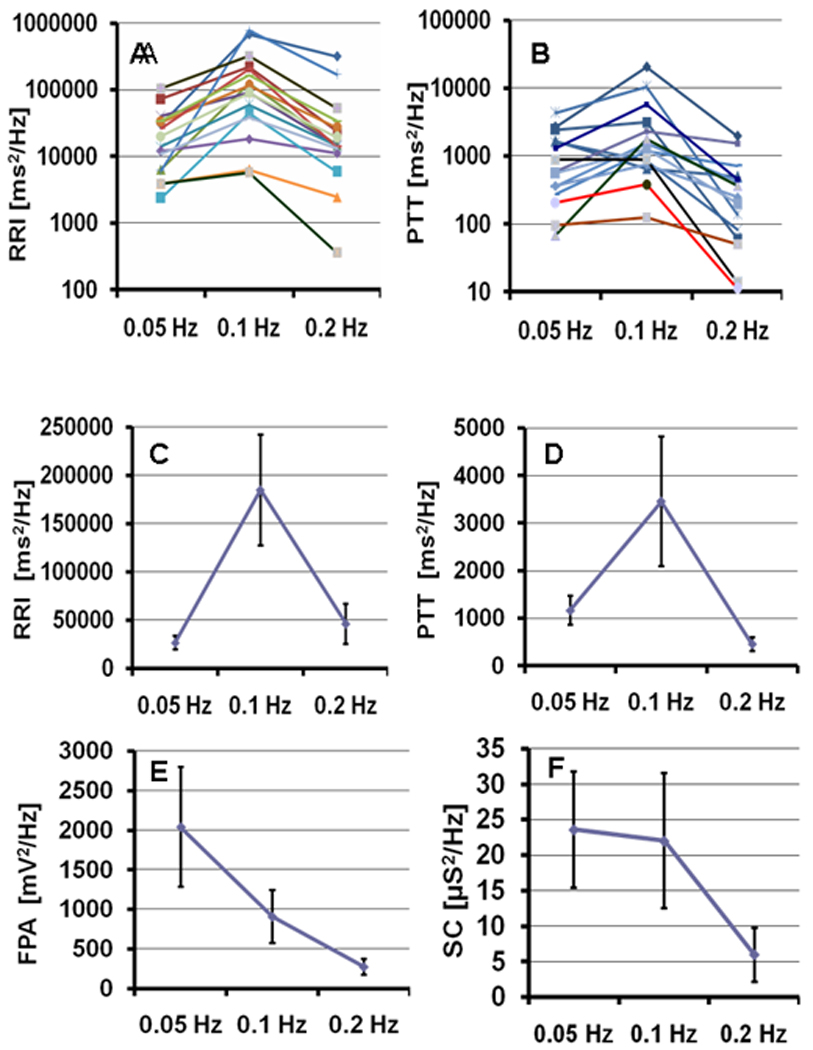
Figure 2.

Spectral estimates of the function oscillatory response to 0.05 Hz, 0.1 Hz, and 0.2 Hz RSMT tasks (Spectral power indices that were measured as the power of RRI, PTT, FPA, SC, and RV spectra for each of the three (0.05 Hz, 0.1 Hz, and 0.2 Hz) Rhythmical Skeletal Muscles Tension (RSMT) stimulation tasks. RRI – R-R interval of ECG; PTT – Pulse Transit Time as time between R wave of ECG and apex of finger pulse; FPA – Finger Pulse Amplitude; SC – Skin Conductance) . A and B - Individual responses of RRI and PTT for each participant. (Note: The Y-axis in A and B utilizes a logarithmic scale). C, D, E, and F – Participants’ averaged RRI, PTT, FPA, and SC responses, respectively. Error bars represent 1.96 standard errors.
