Fig 2.
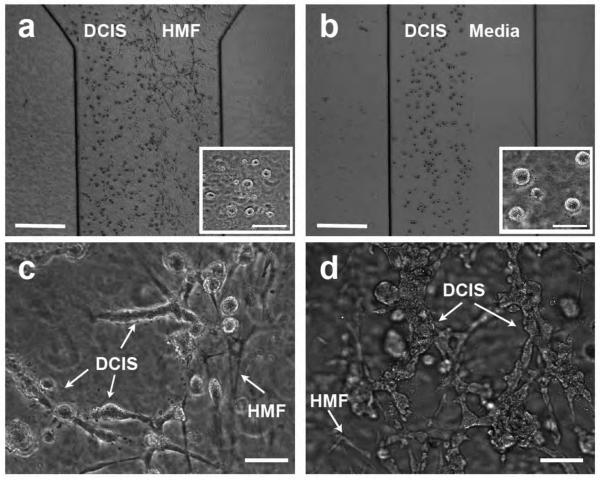
Co-injection and Sequential injection processes. (a) MCF-DCIS cells (left) and HMF cells (right) are co-injected and compartmentalized. The inset shows MCF-DCIS cells imaged 4 hours after loading, showing the size of cells from which the transition process was initiated. (b) The aqueous compartment filled with culture media (right) is created next to the MCF-DCIS cells containing gel compartment, which is replaced by HMF cells containing gel after 6 days' mono-culture of MCF-DCIS cells. The inset shows MCF-DCIS clusters cultured for 6 days, showing the size of cell clusters from which the transition process was initiated. Scale bars in A and B represent 0.5mm, and the ones in insets are 30μm. The invasive transition of MCF-DCIS cells in co-injected culture model (c) and sequentially injected culture model (d), showing more widely spread invasive transition in the sequentially injected culture model after a total of 10 days' culture (6 days' mono-culture, followed by 4 days' co-culture). Co-injected cells were cultured together for 10 days. Scale bars in c and d represent 30μm.

