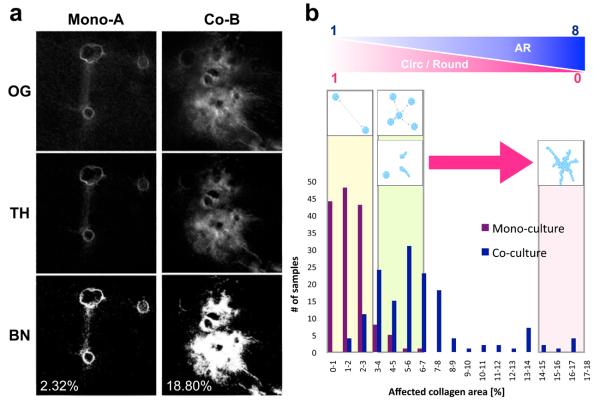
Fig 5.
Area-based SHG signal analysis provides quantitative estimation of the degree of invasive transition of MCF-DCIS cells within a specific area. (a) Three sequential steps involved in image processing for an area-based analysis. The original images (OG) were first thresholded with the value obtained from a blank gel, and the thresholded images (TH) were then converted to binary (BN) for pixel counting. The percentage of affected area in mono-culture (mono-A in Fig 4) is 2.32%, whereas that in co-culture (co-B in Fig 4) is 18.80%. SHG signal values from a blank gel (containing no cells) were applied for thresholding to distinguish SHG signals altered by cells. The numbers represent the percentage of affected collagen area (PAC) in an image. (b) The bar graph is generated after analyzing 150 images each (identical sizes of 1.5 mm2) for both mono- and co-cultured clusters. The bar graph indicates the number of images in a specific range, showing that most of mono-cultured clusters fall into a range between 0 and 3, whereas co-cultured clusters show a range between 1 and 17. Schematic illustration above the bar graph shows representative appearance of clusters in an area corresponding to the PAC range. Circularity and roundness decreases approximately from 1 to 0, while aspect ratio increases from 1 to 8 as PAC increases. Noninvasive clusters apart produce a value close to ‘0’, and more invasive clusters yield a value close to ‘17’.

