
FIGURE 7.
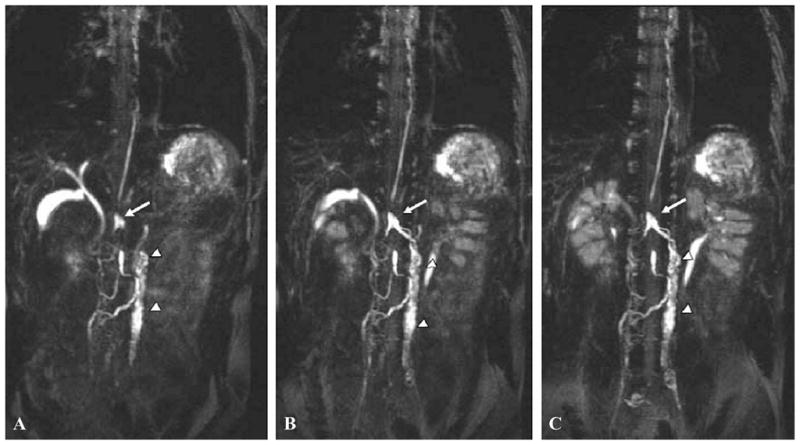
Coronal maximum intensity projection images of a 28-year-old male. Three dimensional heavily T2-weighted images were obtained in the expiratory phase when the diaphragm was at the highest level. (A to C) A high intensity linear structure clearly identifies thoracic duct. Arrows identify a saccular structure to be cysterna chili, and arrowheads indicate lumbar lymphatics and para-aortic lymphatic trunks. The lymphatics were solely identified on the basis of the knowledge of systemic anatomy. (From Matsushima et al.56 Reproduced by permission.)