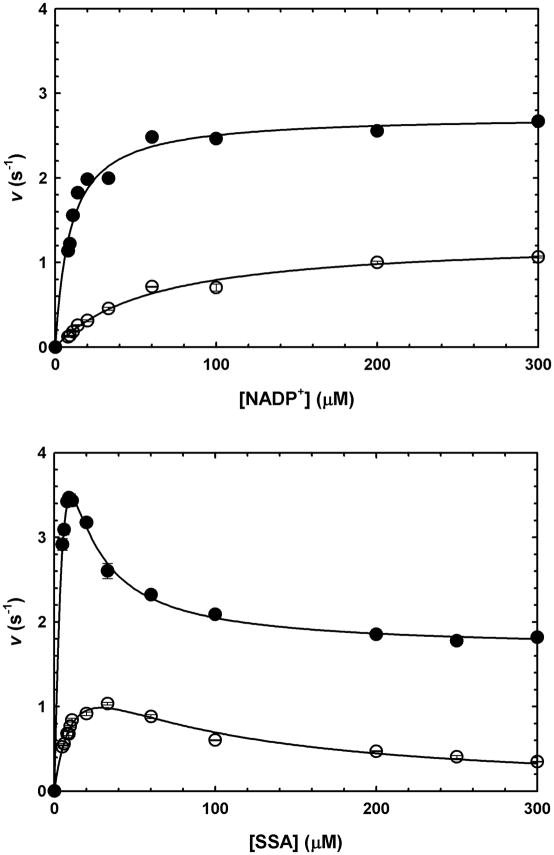
Fig. 4.
GabD1 steady-state kinetics. (a) Titration of GabD1 with NADP+ at constant SSA (50 μM), in the presence (closed circles) or absence (open circles) of Mg2+ (10 mM). Solid lines represent the fit to eq. 4. (b) Titration of GabD1 with SSA at constant NADP+ (200 μM), in the presence (closed circles) or absence (open circles) of Mg2+ (10 mM). Solid lines represent the fit to eq. 2 (open circles) and eq. 3 (solid circles). Open or closed symbols represent data from replicates ± standard error. These results are representative of two independent experiments.

